ScanScreen
A modern Catch system with Trawl Eye, Flow sensors in the trawl opening and belly, Door sensors, and filling indicators in addition to the traditional sensors that laid the foundation for the development of a full capture system provides fishermen with so much important informa tio n that there is a need to use more screens in the system. This is of course even more important to those who fish with two or three trawls.
The usual procedure is to use two or three screens on the bridge console and one by the winch console, but screens can also be placed in the mess hall or other places where the trawl master or others can observe the action.
With the ScanBas system fishermen must switch between diffe rent images; with ScanScreen fishermen have a complete overview of what they want to focus on in every part of the haul.
There are a number of vessels that have use d the ScanScreen for many years and we only receive positive feedback. It is also a fact th at many people who ori ginally bought a ScanBas system later upgraded. One point that is worth emphasizing is that with a ScanScreen system fishermen are able to follow both the Trawl Eye’s detection of fish influx and to view snapshots of the trawl geometry in addition to study ing situations that are under development in various log images, such as:
- Door Distance
- Door Angles and stability
- Precise fish influx in the cod end and filling rate
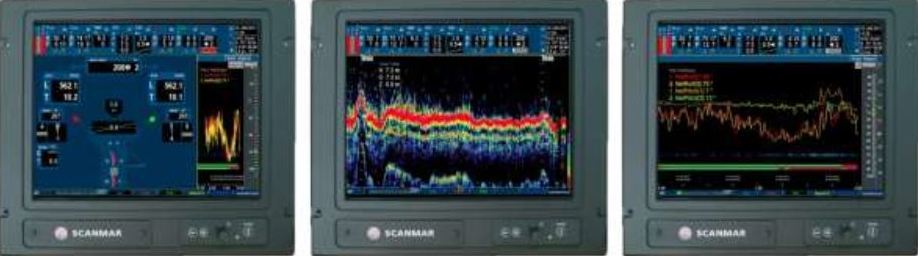
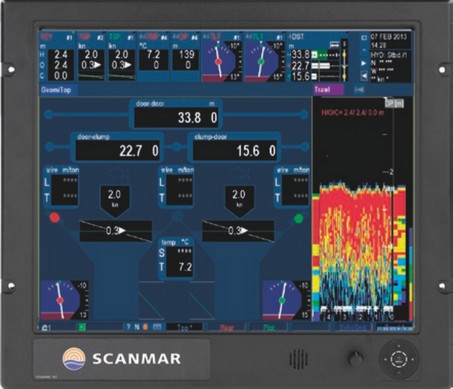
An example of ScanScreen displayed on three screens during cod fishing
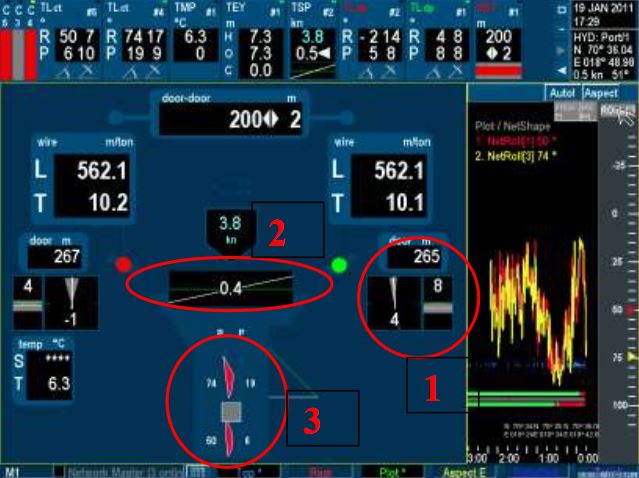 Screen image – Geometry
In the geometry image it is worth noting how easy it is to see that the doors are unstable (1), and that it is due to a side current from the starboard (2). At the same time, one can see that the two Catch sensors in use (3) are activated, and that the bag is twisted to starboard.
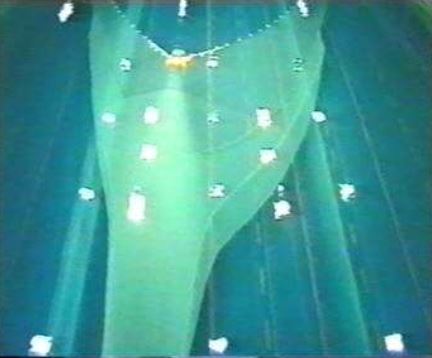
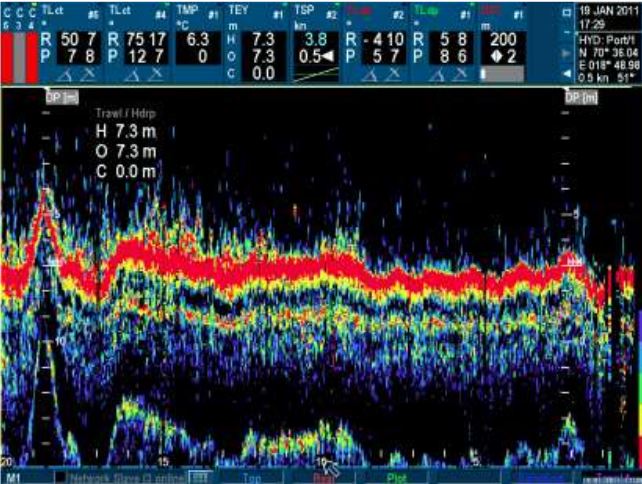 Screen image – Trawl Eye
The Trawl Eye image speaks for itself and you can clearly see where there are concentrations of fish.
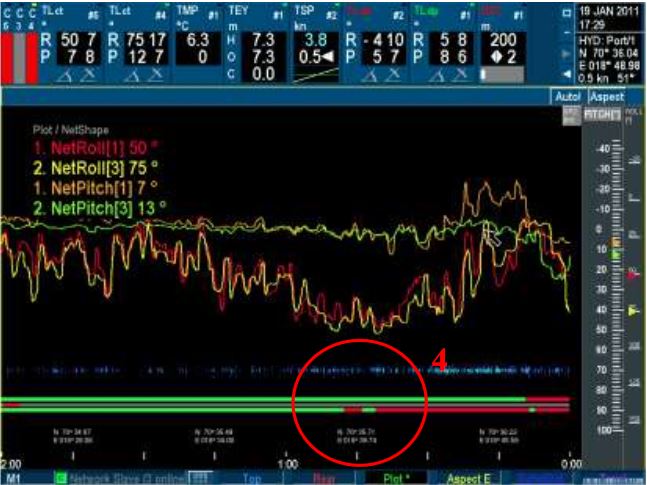 Screen image – Log
The plot image shows the logging of two Filling Indicators (Angle sensors) that are combined with Catch sensors (stretch wire). The curves show the filling rate (repeated in each haul) and the variations show the fish influx. It is easy to see how these correspond with observations in the Trawl Eye image. It is also worth noting how activation of the Catch sensors (4) is matching the filling rate, but especially how the fish influx take s place sometime before the Catch sensors are activated. This inf ormation is often used to turn and tow the same area a second time. From the GPS position you c an see exactly where the fish are entering. Also note how the strong record of fish in the Trawl Eye image also appears in the plot image.